Artaking 2Components of the Indicator:
Moving Averages:
Short-Term Moving Average (MA): This is a 50-period Simple Moving Average (SMA) applied to the closing price. It is used to track the short-term trend of the market.
Long-Term Moving Average (MA): This is a 200-period SMA used to track the long-term trend.
Day Trading Moving Average: A 20-period SMA is used specifically for day trading signals, focusing on shorter-term price movements.
Purpose:
The crossing of these moving averages (short-term crossing above or below long-term) provides basic buy and sell signals, indicative of potential trend reversals or continuations.
ADX (Average Directional Index) for Trend Strength:
ADX Calculation: The ADX is calculated using a 14-period length with 14-period smoothing. The ADX value indicates the strength of a trend, regardless of direction.
Strong Trend Condition: The indicator considers a trend to be strong if the ADX value is above 25. This threshold helps filter out trades during weak or sideways markets.
Purpose:
To ensure that the strategy only generates signals when there is a strong trend, thus avoiding whipsaws in low volatility or range-bound conditions.
Support Levels:
Support Level Calculation: The indicator calculates the lowest close over the last 100 periods. This level is used to identify significant support zones where the price might find a floor.
Purpose:
Support levels are critical in identifying potential areas where the price might bounce, making them ideal for setting stop losses or identifying buy opportunities.
Volatility Spike (Proxy for News Trading):
ATR (Average True Range) Calculation: The indicator uses a 14-period ATR to measure market volatility. A volatility spike is identified when the ATR is greater than 1.5 times the 14-period SMA of the ATR.
Purpose:
This serves as a proxy for news events or other sudden market movements that could make the market unpredictable. The indicator avoids generating signals during these periods to reduce the risk of being caught in a volatile, potentially news-driven move.
Fibonacci Retracement Levels:
61.8% Fibonacci Level: Calculated from the highest high and lowest low over the long MA period, this retracement level is widely regarded as a significant support or resistance level.
Purpose:
Position traders often use Fibonacci levels to identify potential reversal points. The indicator incorporates the 61.8% level to fine-tune entries and exits.
Candlestick Patterns for Price Action Trading:
Bullish Engulfing Pattern: A bullish reversal pattern where a green candle fully engulfs the previous red candle.
Bearish Engulfing Pattern: A bearish reversal pattern where a red candle fully engulfs the previous green candle.
Purpose:
These patterns are classic signals used in price action trading to identify potential reversals at key levels, especially when they align with other conditions like support/resistance or Fibonacci levels.
Signal Generation:
The indicator generates buy and sell signals by combining the above elements:
Buy Signal:
A buy signal is triggered when:
The short-term MA crosses above the long-term MA (indicating a potential uptrend).
The trend is strong (ADX > 25).
The current price is near or below the 61.8% Fibonacci retracement level, suggesting a potential reversal.
No significant volatility spike is detected, ensuring the market isn’t reacting unpredictably to news.
Sell Signal:
A sell signal is triggered when:
The short-term MA crosses below the long-term MA (indicating a potential downtrend).
The trend is strong (ADX > 25).
The current price is near or above the 61.8% Fibonacci retracement level, suggesting potential resistance.
No significant volatility spike is detected.
Day Trading Signals:
Independent of the main trend signals, the indicator also generates intraday buy and sell signals when the price crosses above or below the 20-period day trading MA.
Price Action Signals:
The indicator can trigger buy or sell signals based purely on price action, such as the occurrence of bullish or bearish engulfing patterns. This is optional and can be enabled or disabled.
Alerts:
The indicator includes built-in alert conditions that notify the trader when a buy or sell signal is generated. This allows traders to act immediately without having to constantly monitor the charts.
Practical Application:
This indicator is versatile and can be used across various trading styles:
Position Trading: The long-term MA, Fibonacci retracement, and ADX provide a solid foundation for identifying long-term trends and potential entry/exit points.
Day Trading: The short-term MA and day trading MA offer quick signals for intraday trading.
Price Action: Candlestick pattern recognition allows for precise entry points based on market sentiment and behavior.
News Trading: The volatility spike filter helps avoid trading during periods of market instability, often driven by news events.
Conclusion:
The Comprehensive Trading Strategy Indicator is a robust tool designed to help traders navigate various market conditions by integrating multiple strategies into a single, coherent framework. It provides clear, actionable signals while filtering out potentially dangerous trades during volatile or weak market conditions. Whether you're a long-term trader, a day trader, or someone who relies on price action, this indicator can be a valuable addition to your trading toolkit.
חפש סקריפטים עבור "moving averages"

Volume Insignts AnalyzerDescription:
The Volume Insight Analyzer is an advanced Pine Script designed for traders who want a comprehensive view of volume dynamics on their charts. This script combines multiple volume-based indicators to help identify key trading opportunities, including significant volume days, volume dry-ups, and pocket pivots.
Key Features:
VDU (Volume Dry-Up) Detection: Automatically identifies and marks days when the volume is significantly below its moving average, helping to spot potential breakout or breakdown points. Customizable volume thresholds allow for tailored analysis based on your trading strategy. The Volume Dry-Up label appears when the volume is substantially below its average level and the price is near a key moving average. This condition indicates a period of equilibrium between supply and demand, suggesting a potential low-risk entry point for traders.
Pocket Pivot Analysis using 5 and 10 Length Pocket Pivots: Highlights days with exceptionally high volume compared to recent history, indicating potential pocket pivots. Visual markers on the chart and volume bars color-coded for 5 and 10-day lengths. Pocket pivot points are identified when the volume on a given day exceeds the maximum volume observed over the past several days. Specifically, a 5-day pocket pivot point is marked when today's volume surpasses the highest selling volume of the last 5 days. A cluster of 5-day pocket pivot points within a base is a strong indicator of stock strength. Similarly, a 10-day pocket pivot point following a Volume Dry-Up (VDU) suggests a potential entry opportunity. Moreover, a pre-existing cluster of 5-day pocket pivot points before a 10-day pocket pivot point provides greater conviction in the trade.
Volume Moving Averages: Set different lengths for primary and secondary moving averages to track volume trends over daily, weekly, and monthly timeframes. Options to display moving average lines on the volume chart.
Volume Visualization:
a. Major and Minor Volume Bars: Option to display bars that are either above or below average volume levels. Adjustable settings to show or hide these bars based on user preference.
b. Volume Bar Coloring: Volume bars are color-coded based on significant volume thresholds, including green for bullish signals, red for bearish signals, and orange for volume dry-ups.
Volume Metrics Table: A customizable table that displays real-time volume metrics including Relative Volume (RVOL), Turnover, and the number of high volume days. The table can be oriented horizontally or vertically and styled according to your theme preferences.
Visual Indicators:
a) Volume Dry-Up (VDU) Labels: Clearly marked VDU events with textual annotations on the chart.
b) Bullish and Bearish Arrows: Arrows indicating potential bullish or bearish closes based on volume analysis, enhancing decision-making.
Customization Options:
a) Dark and Light Theme Support: Toggle between dark and light themes to match your chart settings.
b) Adjustable Parameters: Easily configure input settings such as volume thresholds, MA lengths, and table display options to fit your trading style.
How to Use:
Set Parameters: Adjust the script settings such as volume thresholds, moving average lengths, and display preferences according to your analysis needs.
Analyze Volume Patterns: Use the indicators and visual markers provided by the script to identify significant volume patterns and potential trading signals.
Monitor Metrics: Refer to the volume metrics table for a quick overview of key volume-related statistics and trends.
Make Informed Decisions: Utilize the visual cues and volume data provided by the script to enhance your trading strategy and make more informed decisions.
Disclaimer:
This script is for informational purposes only and should not be considered as trading advice. Use it in conjunction with other analysis tools and consult with a financial advisor if needed. Trading involves risk, and past performance does not guarantee future results.

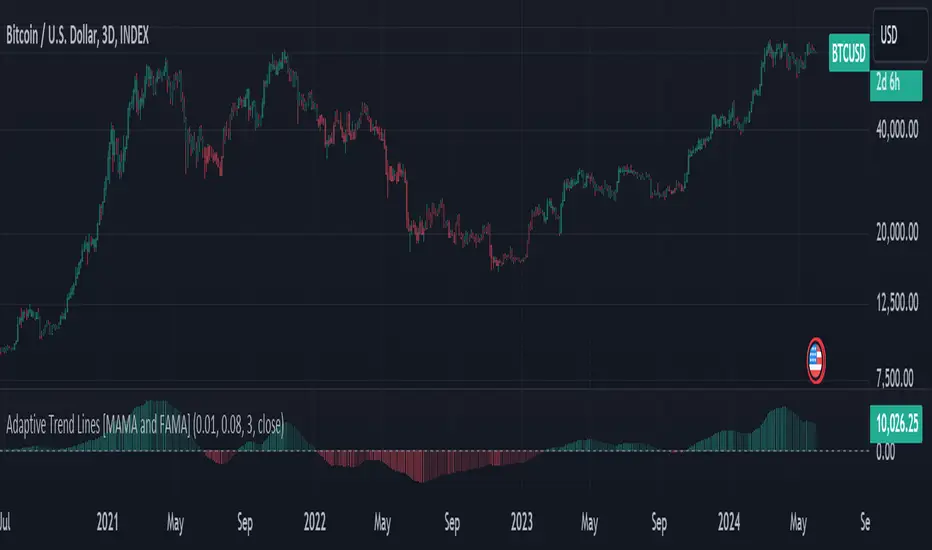
Adaptive Trend Lines [MAMA and FAMA]Updated my previous algo on the Adaptive Trend lines, however I have added new functionalities and sorted out the settings.
You can now switch between normalized and non-normalized settings, the colors have also been updated and look much better.
The MAMA and FAMA
These indicators was originally developed by John F. Ehlers (Stocks & Commodities V. 19:10: MESA Adaptive Moving Averages). Everget wrote the initial functions for these in pine script. I have simply normalized the indicators and chosen to use the Laplace transformation instead of the hilbert transformation
How the Indicator Works:
The indicator employs a series of complex calculations, but we'll break it down into key steps to understand its functionality:
LaplaceTransform: Calculates the Laplace distribution for the given src input. The Laplace distribution is a continuous probability distribution, also known as the double exponential distribution. I use this because of the assymetrical return profile
MESA Period: The indicator calculates a MESA period, which represents the dominant cycle length in the price data. This period is continuously adjusted to adapt to market changes.
InPhase and Quadrature Components: The InPhase and Quadrature components are derived from the Hilbert Transform output. These components represent different aspects of the price's cyclical behavior.
Homodyne Discriminator: The Homodyne Discriminator is a phase-sensitive technique used to determine the phase and amplitude of a signal. It helps in detecting trend changes.
Alpha Calculation: Alpha represents the adaptive factor that adjusts the sensitivity of the indicator. It is based on the MESA period and the phase of the InPhase component. Alpha helps in dynamically adjusting the indicator's responsiveness to changes in market conditions.
MAMA and FAMA Calculation: The MAMA and FAMA values are calculated using the adaptive factor (alpha) and the input price data. These values are essentially adaptive moving averages that aim to capture the current trend more effectively than traditional moving averages.
But Omar, why would anyone want to use this?
The MAMA and FAMA lines offer benefits:
The indicator offers a distinct advantage over conventional moving averages due to its adaptive nature, which allows it to adjust to changing market conditions. This adaptability ensures that investors can stay on the right side of the trend, as the indicator becomes more responsive during trending periods and less sensitive in choppy or sideways markets.
One of the key strengths of this indicator lies in its ability to identify trends effectively by combining the MESA and MAMA techniques. By doing so, it efficiently filters out market noise, making it highly valuable for trend-following strategies. Investors can rely on this feature to gain clearer insights into the prevailing trends and make well-informed trading decisions.
This indicator is primarily suppoest to be used on the big timeframes to see which trend is prevailing, however I am not against someone using it on a timeframe below the 1D, just be careful if you are using this for modern portfolio theory, this is not suppoest to be a mid-term component, but rather a long term component that works well with proper use of detrended fluctuation analysis.
Dont hesitate to ask me if you have any questions
Again, I want to give credit to Everget and ChartPrime!
Code explanation as required by House Rules:
fastLimit = input.float(title='Fast Limit', step=0.01, defval=0.01, group = "Indicator Settings")
slowLimit = input.float(title='Slow Limit', step=0.01, defval=0.08, group = "Indicator Settings")
src = input(title='Source', defval=close, group = "Indicator Settings")
input.float: Used to create input fields for the user to set the fastLimit and slowLimit values.
input: General function to get user inputs, like the data source (close price) used for calculations.
norm_period = input.int(3, 'Normalization Period', 1, group = "Normalized Settings")
norm = input.bool(defval = true, title = "Use normalization", group = "Normalized Settings")
input.int: Creates an input field for the normalization period.
input.bool: Allows the user to toggle normalization on or off.
Color settings in the code:
col_up = input.color(#22ab94, group = "Color Settings")
col_dn = input.color(#f7525f, group = "Color Settings")
Constants and functions
var float PI = math.pi
laplace(src) =>
(0.5) * math.exp(-math.abs(src))
_computeComponent(src, mesaPeriodMult) =>
out = laplace(src) * mesaPeriodMult
out
_smoothComponent(src) =>
out = 0.2 * src + 0.8 * nz(src )
out
math.pi: Represents the mathematical constant π (pi).
laplace: A function that applies the Laplace transform to the source data.
_computeComponent: Computes a component of the data using the Laplace transform.
_smoothComponent: Smooths data by averaging the current value with the previous one (nz function is used to handle null values).
Alpha function:
_computeAlpha(src, fastLimit, slowLimit) =>
mesaPeriod = 0.0
mesaPeriodMult = 0.075 * nz(mesaPeriod ) + 0.54
...
alpha = math.max(fastLimit / deltaPhase, slowLimit)
out = alpha
out
_computeAlpha: Calculates the adaptive alpha value based on the fastLimit and slowLimit. This value is crucial for determining the MAMA and FAMA lines.
Calculating MAMA and FAMA:
mama = 0.0
mama := alpha * src + (1 - alpha) * nz(mama )
fama = 0.0
fama := alpha2 * mama + (1 - alpha2) * nz(fama )
Normalization:
lowest = ta.lowest(mama_fama_diff, norm_period)
highest = ta.highest(mama_fama_diff, norm_period)
normalized = (mama_fama_diff - lowest) / (highest - lowest) - 0.5
ta.lowest and ta.highest: Find the lowest and highest values of mama_fama_diff over the normalization period.
The oscillator is normalized to a range, making it easier to compare over different periods.
And finally, the plotting:
plot(norm == true ? normalized : na, style=plot.style_columns, color=col_wn, title = "mama_fama_diff Oscillator Normalized")
plot(norm == false ? mama_fama_diff : na, style=plot.style_columns, color=col_wnS, title = "mama_fama_diff Oscillator")
Example of Normalized settings:
Example for setup:
Try to make sure the lower timeframe follows the higher timeframe if you take a trade based on this indicator!
Multi-Chart Widget [LuxAlgo]The Multi-Chart Widget tool is a comprehensive solution crafted for traders and investors looking to analyze multiple financial instruments simultaneously. With the capability to showcase up to three additional charts, users can customize each chart by selecting different financial instruments, and timeframes.
Users can add various widely used technical indicators to the charts such as the relative strength index, Supertrend, moving averages, Bollinger Bands...etc.
🔶 USAGE
The tool offers traders and investors a comprehensive view of multiple charts simultaneously. By displaying up to three additional charts alongside the primary chart, users can analyze assets across different timeframes, compare their performance, and make informed decisions.
Users have the flexibility to choose from various customizable chart types, including the recently added "Volume Candles" option.
This tool allows adding to the chart some of the most widely used technical indicators, such as the Supertrend, Bollinger Bands, and various moving averages.
In addition to the charting capabilities, the tool also features a dynamic statistic panel that provides essential metrics and key insights into the selected assets. Users can track performance indicators such as relative strength, trend, and volatility, enabling them to identify trends, patterns, and trading opportunities efficiently.
🔶 DETAILS
A brief overview of the indicators featured in the statistic panel is given in the sub-section below:
🔹Dual Supertrend
The Dual Supertrend is a modified version of the Supertrend indicator, which is based on the concept of trend following. It generates buy or sell signals by analyzing the asset's price movement. The Dual Supertrend incorporates two Supertrend indicators with different parameters to provide potentially more accurate signals. It helps traders identify trend reversals and establish trend direction in a more responsive manner compared to a single Supertrend.
🔹Relative Strength Index
The Relative Strength Index is a momentum oscillator that measures the speed and change of price movements. RSI oscillates between 0 and 100 and is typically used to identify overbought or oversold conditions in a market. Traditionally, RSI values above 70 are considered overbought, suggesting that the asset may be due for a reversal or correction, while RSI values below 30 are considered oversold, indicating potential buying opportunities.
🔹Volatility
Volatility in trading refers to the degree of variation or fluctuation in the price of a financial instrument, such as a stock, currency pair, or commodity, over a certain period of time. It is a measure of the speed and magnitude of price changes and reflects the level of uncertainty or risk in the market. High volatility implies that prices are experiencing rapid and significant movements, while low volatility suggests that prices are relatively stable and are not changing much. Traders often use volatility as an indicator to assess the potential risk and return of an investment and to make informed decisions about when to enter or exit trades.
🔹R-Squared (R²)
R-squared, also known as the coefficient of determination, is a statistical measure that indicates the proportion of the variance in the dependent variable that is predictable from the independent variable(s). In other words, it quantifies the goodness of fit of a regression model to the observed data. R-squared values range from %0 to %100, with higher values indicating a better fit of the model to the data. An R-squared of 100% means that all movements of a security are completely explained by movements in the index, while an R-squared value of %0 indicates that the model does not explain any of the variability in the dependent variable.
In simpler terms, in investing, a high R-squared, from 85% to 100%, indicates that the stock’s or fund’s performance moves relatively in line with the index. Conversely, a low R-squared (around 70% or less) indicates that the fund's performance tends to deviate significantly from the movements of the index.
🔶 SETTINGS
🔹Mini Chart(s) Generic Settings
Mini Charts Separator: This option toggles the visibility of the separator lines.
Number Of Bars: Specifies the number of bars to be displayed for each mini chart.
Horizontal Offset: Determines the distance at which the mini charts will be displayed from the primary chart.
🔹Mini Chart Settings: Top - Middle - Bottom
Mini Chart Top/Middle/Bottom: Toggle the visibility of the selected mini chart.
Symbol: Choose the financial instrument to be displayed in the mini chart. If left as an empty string, it will default to the current chart instrument.
Timeframe: This option determines the timeframe used for calculating the mini charts. If a timeframe lower than the chart's timeframe is selected, the calculations will be based on the chart's timeframe.
Chart Type: Selection from various chart types for the mini charts, including candles, volume candles, line, area, columns, high-low, and Heikin Ashi.
Chart Size: Determines the size of the mini chart.
Technical Indicator: Selection from various technical indicators to be displayed on top of the mini charts.
Note : Chart sizing is relative to other mini charts. For example, If all the mini charts are sized to x5 relative to each other, the result will be the same as if they were all sized as x1. This is because the relative proportions between the mini charts remain consistent regardless of their absolute sizes. Therefore, their positions and sizes relative to each other remain unchanged, resulting in the same visual representation despite the differences in absolute scale.
🔹Supertrend Settings
ATR Length: is the lookback length for the ATR calculation.
Factor: is what the ATR is multiplied by to offset the bands from price.
Color: color customization option.
🔹Moving Average Settings
Type: is the type of the moving average, available types of moving averages include SMA (Simple Moving Average), EMA (Exponential Moving Average), RMA (Root Mean Square Moving Average), HMA (Hull Moving Average), WMA (Weighted Moving Average), and VWMA (Volume Weighted Moving Average).
Source: Determines what data from each bar will be used in calculations.
Length: The time period to be used in calculating the Moving Average.
Color: Color customization option.
🔹Bollinger Bands Settings
Basis Type: Determines the type of Moving Average that is applied to the basis plot line.
Source: Determines what data from each bar will be used in calculations.
Length: The time period to be used in calculating the Moving Average which creates the base for the Upper and Lower Bands.
StdDev: The number of Standard Deviations away from the Moving Average that the Upper and Lower Bands should be.
Color: Color customization options for basis, upper and lower bands.
🔹Mini Chart(s) Panel Settings
Mini Chart(s) Panel: Controls the visibility of the panel containing the mini charts.
Dual Supertrend: Toggles the display of the evaluated dual super trend, based on the super trend settings provided below the option. The definitions for the options are the same as stated above for the super trend.
Relative Strength Index: Toggles the display of the evaluated RSI, based on the source and length settings provided below the option.
Volatility: Toggles the display of the calculated Volatility, based on the length settings provided below the option.
R-Squared: Toggles the display of the calculated R-Squared (R²), based on the length settings provided below the option.
🔶 LIMITATIONS
The tool allows users to display mini charts featuring various types of instruments alongside the primary chart instrument. However, there's a limitation: the selected primary chart instrument must have an ACTIVE market status. Alternatively, if the primary chart instrument is not active, the mini chart instruments must belong to the same exchange and have the same type as the primary chart instrument.

Support Resistance & Ema
The "Support Resistance & Ema" indicator combines various strategies to assist traders in identifying significant support and resistance levels on the chart and in following trends through exponential moving averages (EMA). This script is designed to be versatile and useful in different trading strategies.
Key Features:
Support and Resistance: It utilizes pivot highs and lows to pinpoint support and resistance levels. These levels are plotted on the chart with lines that change color based on trend reversals.
Trend Identification: The indicator follows trends using four conditions:
_hh: Higher highs and higher lows, indicating an uptrend.
_ll: Lower highs and lower lows, indicating a downtrend.
_hl: Higher highs and lower lows, indicating weakening uptrend or an impending reversal.
_lh: Lower highs and higher lows, indicating weakening downtrend or an impending reversal.
Exponential Moving Averages (EMA): It also displays various EMAs (9, 21, 50, 100, 200) on the chart to provide further insights into the trend direction.
Usage:
Support and Resistance: Support and resistance lines are automatically plotted on the chart. Trend reversals are highlighted by changing the color of the lines.
Trend Identification: The _hh, _ll, _hl, _lh conditions help identify trend changes. When one of these conditions is met, it indicates a particular configuration of highs and lows that might suggest a trading opportunity.
Exponential Moving Averages (EMA): The EMAs are plotted on the chart and can be used to confirm trends identified by the main indicator.
To use this script, you need to add it as an indicator to your trading chart. Once applied, the support, resistance lines, and EMAs will be visible on the chart, providing traders with valuable information to make informed trading decisions.
In summary, this script offers a comprehensive way to identify significant support and resistance levels, spot market trends, and confirm those trends through the use of exponential moving averages.

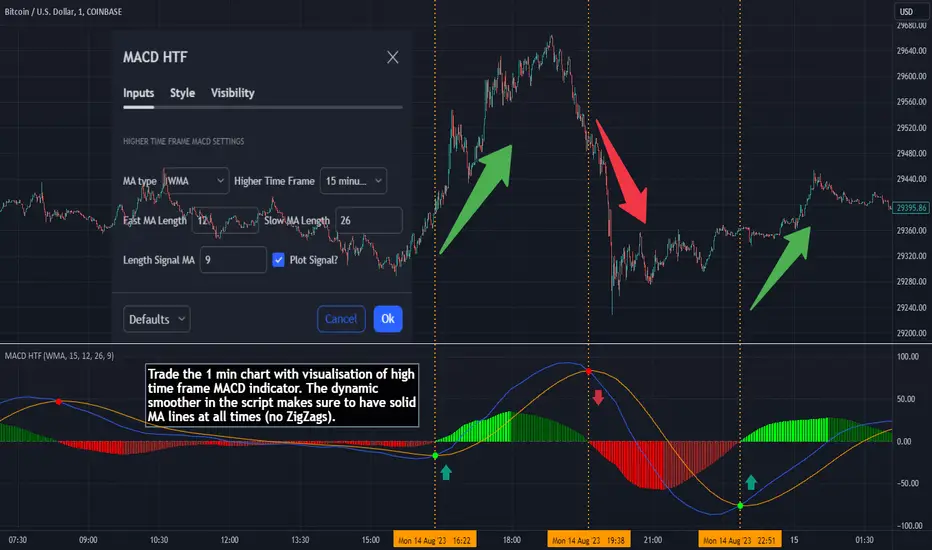
MACD HTF - Dynamic SmoothingEnhancing Your 1-Minute Trades with Dynamic HTF MACD Smoothing
Ever found yourself glued to a 1-minute chart, trying to catch every minor price movement, yet feeling like you're missing the bigger picture? Picture this: a solid MACD line on that chart, dynamically smoothed from a higher timeframe (HTF). This tool offers two significant benefits over other existing HTF MACD indicators:
User-Friendly Interface: No need to manually adjust input parameters every time you switch to a different timeframe.
Smooth Charting: Say goodbye to the zigzag lines that often result from plotting higher time frame resolutions on a lower time frame.
Understanding the MACD
The Moving Average Convergence Divergence (MACD) is one of the most widely used and trusted technical indicators in the trading community. Invented by Gerald Appel in the late 1970s, the MACD helps traders understand the relationship between two moving averages of a security's price. It consists of the MACD line (difference between a 12-period and 26-period Exponential Moving Average) and the Signal line (9-period EMA of the MACD line). When the MACD line crosses above the Signal line, it's viewed as a bullish signal, and vice versa. The difference between the two lines is represented as a histogram, providing insights into potential buy or sell opportunities.
Features of the Dynamic HTF MACD Smoothing Script
Time Frame Flexibility: Choose a higher timeframe to derive MACD values and apply dynamic smoothing to your current timeframe.
Multiple Moving Averages: The script supports various MA types like EMA, SMA, DEMA, TEMA, WMA and HMA.
Alerts: Get real-time alerts for MACD crossover and crossunder.
Customizability: From the type of moving average to its length, customize as per your strategy.
Visual Indicators: Clearly plots signals when MACD crossover or crossunder occurs for potential entries.
At last
A massive shoutout to all the wizards and generous contributors in the community! You inspire innovations and new tools, paving the path forward. Here's to a community where we learn and build together. Cheers to collective growth!
Normalized Adaptive Trend Lines [MAMA and FAMA]These indicators was originally developed by John F. Ehlers (Stocks & Commodities V. 19:10: MESA Adaptive Moving Averages). Everget wrote the initial functions for these in pine script. I have simply normalized the indicators and chosen to use the Laplace transformation instead of the hilbert transformation
How the Indicator Works:
The indicator employs a series of complex calculations, but we'll break it down into key steps to understand its functionality:
LaplaceTransform: Calculates the Laplace distribution for the given src input. The Laplace distribution is a continuous probability distribution, also known as the double exponential distribution. I use this because of the assymetrical return profile
MESA Period: The indicator calculates a MESA period, which represents the dominant cycle length in the price data. This period is continuously adjusted to adapt to market changes.
InPhase and Quadrature Components: The InPhase and Quadrature components are derived from the Hilbert Transform output. These components represent different aspects of the price's cyclical behavior.
Homodyne Discriminator: The Homodyne Discriminator is a phase-sensitive technique used to determine the phase and amplitude of a signal. It helps in detecting trend changes.
Alpha Calculation: Alpha represents the adaptive factor that adjusts the sensitivity of the indicator. It is based on the MESA period and the phase of the InPhase component. Alpha helps in dynamically adjusting the indicator's responsiveness to changes in market conditions.
MAMA and FAMA Calculation: The MAMA and FAMA values are calculated using the adaptive factor (alpha) and the input price data. These values are essentially adaptive moving averages that aim to capture the current trend more effectively than traditional moving averages.
But Omar, why would anyone want to use this?
The MAMA and FAMA lines offer benefits:
The indicator offers a distinct advantage over conventional moving averages due to its adaptive nature, which allows it to adjust to changing market conditions. This adaptability ensures that investors can stay on the right side of the trend, as the indicator becomes more responsive during trending periods and less sensitive in choppy or sideways markets.
One of the key strengths of this indicator lies in its ability to identify trends effectively by combining the MESA and MAMA techniques. By doing so, it efficiently filters out market noise, making it highly valuable for trend-following strategies. Investors can rely on this feature to gain clearer insights into the prevailing trends and make well-informed trading decisions.
This indicator is primarily suppoest to be used on the big timeframes to see which trend is prevailing, however I am not against someone using it on a timeframe below the 1D, just be careful if you are using this for modern portfolio theory, this is not suppoest to be a mid-term component, but rather a long term component that works well with proper use of detrended fluctuation analysis.
Dont hesitate to ask me if you have any questions
Again, I want to give credit to Everget and ChartPrime!

EMA-Deviation-Corrected T3 [Loxx]EMA-Deviation-Corrected T3 is a T3 moving average that uses EMA deviation correcting to produce signals. This comes via the beloved genius Mladen.
The origin of the correcting algorithm can be attributed to Dr. Alexander Uhl, who developed a method to filter the moving average and identify signals. Originally, this method utilized standard deviation as a measure to correct the average values.
However, the current indicator in question employs a modified version of the correcting method. Instead of using standard deviation for calculation, it uses EMA deviation, which stands for Exponential Moving Average deviation. The idea behind using EMA deviation is two-fold:
Efficiency: EMA deviation can be calculated faster than standard deviation, resulting in more efficient code execution.
Signal Reduction: Surprisingly, this modified "correcting" approach generates fewer signals compared to using standard deviation. This is because EMA deviation is more responsive to price changes, making the correcting process less sensitive to whipsaws or false signals.
What is T3?
The T3 moving average, short for "Tim Tillson's Triple Exponential Moving Average," is a technical indicator used in financial markets and technical analysis to smooth out price data over a specific period. It was developed by Tim Tillson, a software project manager at Hewlett-Packard, with expertise in Mathematics and Computer Science.
The T3 moving average is an enhancement of the traditional Exponential Moving Average (EMA) and aims to overcome some of its limitations. The primary goal of the T3 moving average is to provide a smoother representation of price trends while minimizing lag compared to other moving averages like Simple Moving Average (SMA), Weighted Moving Average (WMA), or EMA.
To compute the T3 moving average, it involves a triple smoothing process using exponential moving averages. Here's how it works:
Calculate the first exponential moving average (EMA1) of the price data over a specific period 'n.'
Calculate the second exponential moving average (EMA2) of EMA1 using the same period 'n.'
Calculate the third exponential moving average (EMA3) of EMA2 using the same period 'n.'
The formula for the T3 moving average is as follows:
T3 = 3 * (EMA1) - 3 * (EMA2) + (EMA3)
By applying this triple smoothing process, the T3 moving average is intended to offer reduced noise and improved responsiveness to price trends. It achieves this by incorporating multiple time frames of the exponential moving averages, resulting in a more accurate representation of the underlying price action.
Included
Bar coloring
Signals
Alerts
Loxx's Expanded Source Types

Scalping Strategy (5min)This indicator is designed for scalping strategies on a 5-minute timeframe. It generates signals based on two RSI crossovers and incorporates moving averages to identify trends. Additionally, a Bollinger Band is included to eliminate the need for an additional Bollinger Band on the chart.
Please note that this indicator does not guarantee 100% accurate signals and may produce false signals. It is recommended to use this indicator in conjunction with other indicators such as Stochastic, MACD, SuperTrend, or any other suitable indicators to enhance the accuracy of trading decisions.
1) Signal Generation: The indicator generates buy and sell signals based on two RSI crossovers. A buy signal is generated when the fast RSI crosses above the slow RSI, indicating potential bullish momentum. Conversely, a sell signal is generated when the fast RSI crosses below the slow RSI, suggesting potential bearish momentum.
2) To adjust the indicator to your specific chart and trading preferences, you have the flexibility to modify the RSI and moving average (MA) values. By changing the RSI values (slow RSI length and fast RSI length), you can fine-tune the sensitivity of the RSI crossovers to suit different timeframes and market conditions. Similarly, adjusting the MA values (slow MA period and fast MA period) allows you to adapt the indicator to the desired trend identification and short-term trend confirmation.
3) Pay attention to trades that are confirmed by the short-term moving average (MA) aligning with the desired direction. For buy signals, ensure that the short MA is tending upward, indicating a potential uptrend. For sell signals, confirm that the short MA is trending downward, suggesting a potential downtrend.
4) Moving Averages: The indicator uses a 200-period moving average (MA) to identify the overall trend and a short-term MA for additional confirmation.
5) Bollinger Band: The included Bollinger Band is not directly used in the indicator's calculations. However, it is provided for convenience so that users don't need to add another Bollinger Band to their chart separately.
6) Exercise caution when the short MA is below the 200-period MA but showing signs of attempting an upward move. These situations may indicate a potential reversal or consolidation, and it is advisable to avoid taking trades solely based on the 200-period MA crossover in such cases.
Remember that these guidelines are intended to provide additional insights and should be used in combination with your trading judgment and analysis.

Customizable Moving Average RibbonThis indicator is a highly customizable moving average ribbon with some unique features.
This script can utilize multiple unique sources, including a non-repainting renko closing price. Renko charts focus solely on price movement and minimize the impacts of time and the extra noise time creates. Employing the renko close helps smooth out the MA ribbon. Insignificant price movements will not cause a change in the plotted lines of the indicator unless a new threshold is breached or a "brick" is created. This is highly useful for quickly identifying consolidation areas or overall flat price movement.
There are two methods for selecting the box size when utilizing the renko source. Box size is critical for the overall function and efficacy of the plots you will visually see with this indicator. Box size is set automatically using the Average True Range "ATR" or manually using the "Traditional" setting. The simplest way to determine a manual box size is to take the ATR of the given instrument and round it to the nearest decimal place. As an example, if the ATR for the asset is 0.18, you would round that number to 0.2 and utilize this as your traditional box size.
The MA ribbon contains eleven adjustable moving average lines. Users can choose to turn off as many as they would like. Users can also adjust the length of the individual moving averages and the source for all moving averages. There are nine types of moving averages to choose from for the ribbon. The MA options are:
Exponential Moving Average = 'EMA'
Double Exponential Moving Average= 'DEMA'
Triple Exponential Moving Average = 'TEMA'
Simple Moving Average = 'SMA'
Relative Moving Average = 'RMA'
Volume Weighted Moving Average = 'VWMA'
Weighted Moving Average = 'WMA'
Smoothed Simple Moving Average = 'SSMA'
Hull Moving Average = 'HULL'
We believe that the ribbons features, including the line color change, help quickly identify trends and give users optimum customization. Users can select from five different color schemes including:
Green/Red
Purple/White
White/Blue
Silver / Orange
Teal/ Orange

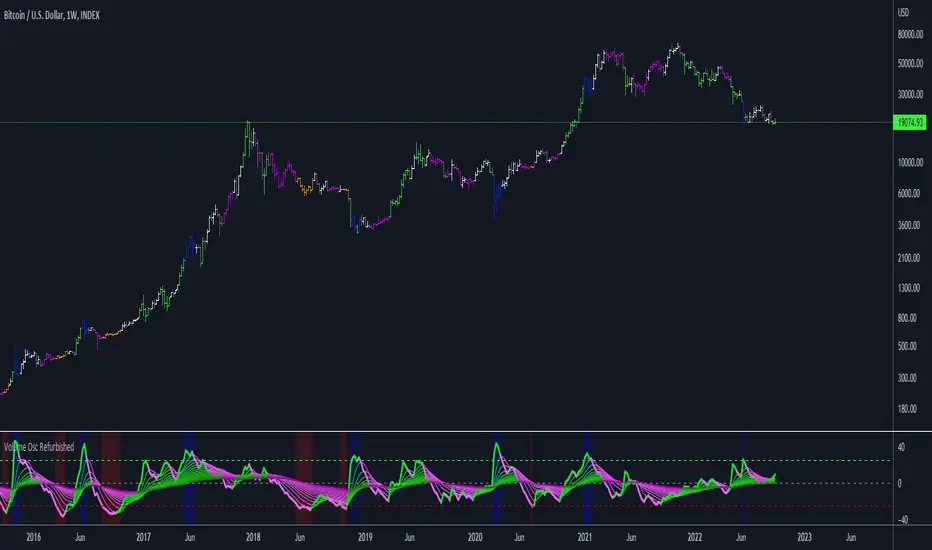
Volume Oscillator RefurbishedThis is an experimental version of Volume Oscillator.
For more information about Volume Oscillator, please access the link below:
www.tradingview.com
Objective
The script presented here provides some improvements over the original indicator, namely:
Show multiple moving averages;
Color the bars according to the direction of the averages;
Color the bars when reaching predefined limits.
Below is the print comparing with the original indicator:
Thanks and credits:
Volume Oscillator: TradingView
Moving Averages: PineCoders, CrackingCryptocurrency, MightyZinger, Alex Orekhov (everget), alexgrover, paragjyoti2012, Franklin Moormann (cheatcountry)
Cutlers RSICutlers' RSI is a variation of the original RSI Developed by Welles Wilder.
This variation uses a simple moving average instead of an exponetial.
Since a simple moving average is used by this variation, a longer length tends to give better results compared to a shorter length.
CALCULATION
Step1: Calculating the Gains and Losses within the chosen period.
Step2: Calculating the simple moving averages of gains and losses.
Step3: Calculating Cutler’s Relative Strength (RS). Calculated using the following:
-> Cutler’s RS = SMA(gains,length) / SMA(losses,length)
Step 4: Calculating the Cutler’s Relative Strength Index (RSI). Calculated used the following:
-> RSI = 100 —
I have added some signals and filtering options with moving averages:
Trend OB/OS: Uptrend after above Overbought Level. Downtrend after below Oversold Level.
OB/OS: When above Overbought, or below oversold
50-Cross: Above 50 line is uptrend, below is downtrend
Direction: Moving up or down
RSI vs MA: RSI above MA is an uptrend, RSI below MA is a downtrend
The signals I added are just some potential ideas, always backtest your own strategies.

Delta Volume Channels [LucF]█ OVERVIEW
This indicator displays on-chart visuals aimed at making the most of delta volume information. It can color bars and display two channels: one for delta volume, another calculated from the price levels of bars where delta volume divergences occur. Markers and alerts can also be configured using key conditions, and filtered in many different ways. The indicator caters to traders who prefer chart visuals over raw values. It will work on historical bars and in real time, using intrabar analysis to calculate delta volume in both conditions.
█ CONCEPTS
Delta Volume
The volume delta concept divides a bar's volume in "up" and "down" volumes. The delta is calculated by subtracting down volume from up volume. Many calculation techniques exist to isolate up and down volume within a bar. The simplest techniques use the polarity of interbar price changes to assign their volume to up or down slots, e.g., On Balance Volume or the Klinger Oscillator . Others such as Chaikin Money Flow use assumptions based on a bar's OHLC values. The most precise calculation method uses tick data and assigns the volume of each tick to the up or down slot depending on whether the transaction occurs at the bid or ask price. While this technique is ideal, it requires huge amounts of data on historical bars, which usually limits the historical depth of charts and the number of symbols for which tick data is available.
This indicator uses intrabar analysis to achieve a compromise between the simplest and most precise methods of calculating volume delta. In the context where historical tick data is not yet available on TradingView, intrabar analysis is the most precise technique to calculate volume delta on historical bars on our charts. TradingView's Volume Profile built-in indicators use it, as do the CVD - Cumulative Volume Delta Candles and CVD - Cumulative Volume Delta (Chart) indicators published from the TradingView account . My Volume Delta Columns Pro indicator also uses intrabar analysis. Other volume delta indicators such as my Realtime 5D Profile use realtime chart updates to achieve more precise volume delta calculations. Indicators of that type cannot be used on historical bars however; they only work in real time.
This is the logic I use to assign intrabar volume to up or down slots:
• If the intrabar's open and close values are different, their relative position is used.
• If the intrabar's open and close values are the same, the difference between the intrabar's close and the previous intrabar's close is used.
• As a last resort, when there is no movement during an intrabar and it closes at the same price as the previous intrabar, the last known polarity is used.
Once all intrabars making up a chart bar have been analyzed and the up or down property of each intrabar's volume determined, the up volumes are added and the down volumes subtracted. The resulting value is volume delta for that chart bar, which can be used as an estimate of the buying/selling pressure on an instrument.
Delta Volume Percent (DV%)
This value is the proportion that delta volume represents of the total intrabar volume in the chart bar. Note that on some symbols/timeframes, the total intrabar volume may differ from the chart's volume for a bar, but that will not affect our calculations since we use the total intrabar volume.
Delta Volume Channel
The DV channel is the space between two moving averages: the reference line and a DV%-weighted version of that reference. The reference line is a moving average of a type, source and length which you select. The DV%-weighted line uses the same settings, but it averages the DV%-weighted price source.
The weight applied to the source of the reference line is calculated from two values, which are multiplied: DV% and the relative size of the bar's volume in relation to previous bars. The effect of this is that DV% values on bars with higher total volume will carry greater weight than those with lesser volume.
The DV channel can be in one of four states, each having its corresponding color:
• Bull (teal): The DV%-weighted line is above the reference line.
• Strong bull (lime): The bull condition is fulfilled and the bar's close is above the reference line and both the reference and the DV%-weighted lines are rising.
• Bear (maroon): The DV%-weighted line is below the reference line.
• Strong bear (pink): The bear condition is fulfilled and the bar's close is below the reference line and both the reference and the DV%-weighted lines are falling.
Divergences
In the context of this indicator, a divergence is any bar where the slope of the reference line does not match that of the DV%-weighted line. No directional bias is assigned to divergences when they occur.
Divergence Channel
The divergence channel is the space between two levels (by default, the bar's low and high ) saved when divergences occur. When price has breached a channel and a new divergence occurs, a new channel is created. Until that new channel is breached, bars where additional divergences occur will expand the channel's levels if the bar's price points are outside the channel.
Prices breaches of the divergence channel will change its state. Divergence channels can be in one of five different states:
• Bull (teal): Price has breached the channel to the upside.
• Strong bull (lime): The bull condition is fulfilled and the DV channel is in the strong bull state.
• Bear (maroon): Price has breached the channel to the downside.
• Strong bear (pink): The bear condition is fulfilled and the DV channel is in the strong bear state.
• Neutral (gray): The channel has not been breached.
█ HOW TO USE THE INDICATOR
Load the indicator on an active chart (see here if you don't know how).
The default configuration displays:
• The DV channel, without the reference or DV%-weighted lines.
• The Divergence channel, without its level lines.
• Bar colors using the state of the DV channel.
The default settings use an Arnaud-Legoux moving average on the close and a length of 20 bars. The DV%-weighted version of it uses a combination of DV% and relative volume to calculate the ultimate weight applied to the reference. The DV%-weighted line is capped to 5 standard deviations of the reference. The lower timeframe used to access intrabars automatically adjusts to the chart's timeframe and achieves optimal balance between the number of intrabars inspected in each chart bar, and the number of chart bars covered by the script's calculations.
The Divergence channel's levels are determined using the high and low of the bars where divergences occur. Breaches of the channel require a bar's low to move above the top of the channel, and the bar's high to move below the channel's bottom.
No markers appear on the chart; if you want to create alerts from this script, you will need first to define the conditions that will trigger the markers, then create the alert, which will trigger on those same conditions.
To learn more about how to use this indicator, you must understand the concepts it uses and the information it displays, which requires reading this description. There are no videos to explain it.
█ FEATURES
The script's inputs are divided in four sections: "DV channel", "Divergence channel", "Other Visuals" and "Marker/Alert Conditions". The first setting is the selection method used to determine the intrabar precision, i.e., how many lower timeframe bars (intrabars) are examined in each chart bar. The more intrabars you analyze, the more precise the calculation of DV% results will be, but the less chart coverage can be covered by the script's calculations.
DV Channel
Here, you control the visibility and colors of the reference line, its weighted version, and the DV channel between them.
You also specify what type of moving average you want to use as a reference line, its source and length. This acts as the DV channel's baseline. The DV%-weighted line is also a moving average of the same type and length as the reference line, except that it will be calculated from the DV%-weighted source used in the reference line. By default, the DV%-weighted line is capped to five standard deviations of the reference line. You can change that value here. This section is also where you can disable the relative volume component of the weight.
Divergence Channel
This is where you control the appearance of the divergence channel and the key price values used in determining the channel's levels and breaching conditions. These choices have an impact on the behavior of the channel. More generous level prices like the default low and high selection will produce more conservative channels, as will the default choice for breach prices.
In this section, you can also enable a mode where an attempt is made to estimate the channel's bias before price breaches the channel. When it is enabled, successive increases/decreases of the channel's top and bottom levels are counted as new divergences occur. When one count is greater than the other, a bull/bear bias is inferred from it.
Other Visuals
You specify here:
• The method used to color chart bars, if you choose to do so.
• The display of a mark appearing above or below bars when a divergence occurs.
• If you want raw values to appear in tooltips when you hover above chart bars. The default setting does not display them, which makes the script faster.
• If you want to display an information box which by default appears in the lower left of the chart.
It shows which lower timeframe is used for intrabars, and the average number of intrabars per chart bar.
Marker/Alert Conditions
Here, you specify the conditions that will trigger up or down markers. The trigger conditions can include a combination of state transitions of the DV and the divergence channels. The triggering conditions can be filtered using a variety of conditions.
Configuring the marker conditions is necessary before creating an alert from this script, as the alert will use the marker conditions to trigger.
Markers only appear on bar closes, so they will not repaint. Keep in mind, when looking at markers on historical bars, that they are positioned on the bar when it closes — NOT when it opens.
Raw values
The raw values calculated by this script can be inspected using a tooltip and the Data Window. The tooltip is visible when you hover over the top of chart bars. It will display on the last 500 bars of the chart, and shows the values of DV, DV%, the combined weight, and the intermediary values used to calculate them.
█ INTERPRETATION
The aim of the DV channel is to provide a visual representation of the buying/selling pressure calculated using delta volume. The simplest characteristic of the channel is its bull/bear state. One can then distinguish between its bull and strong bull states, as transitions from strong bull to bull states will generally happen when buyers are losing steam. While one should not infer a reversal from such transitions, they can be a good place to tighten stops. Only time will tell if a reversal will occur. One or more divergences will often occur before reversals.
The nature of the divergence channel's design makes it particularly adept at identifying consolidation areas if its settings are kept on the conservative side. A gray divergence channel should usually be considered a no-trade zone. More adventurous traders can use the DV channel to orient their trade entries if they accept the risk of trading in a neutral divergence channel, which by definition will not have been breached by price.
If your charts are already busy with other stuff you want to hold on to, you could consider using only the chart bar coloring component of this indicator:
At its simplest, one way to use this indicator would be to look for overlaps of the strong bull/bear colors in both the DV channel and a divergence channel, as these identify points where price is breaching the divergence channel when buy/sell pressure is consistent with the direction of the breach. I have highlighted all those points in the chart below. Not all of them would have produced profitable trades, but nothing is perfect in the markets. Also, keep in mind that the circles identify the visual you would be looking for — not the trade's entry level.
█ LIMITATIONS
• The script will not work on symbols where no volume is available. An error will appear when that is the case.
• Because a maximum of 100K intrabars can be analyzed by a script, a compromise is necessary between the number of intrabars analyzed per chart bar
and chart coverage. The more intrabars you analyze per chart bar, the less coverage you will obtain.
The setting of the "Intrabar precision" field in the "DV channel" section of the script's inputs
is where you control how the lower timeframe is calculated from the chart's timeframe.
█ NOTES
Volume Quality
If you use volume, it's important to understand its nature and quality, as it varies with sectors and instruments. My Volume X-ray indicator is one way you can appraise the quality of an instrument's intraday volume.
For Pine Script™ Coders
• This script uses the new overload of the fill() function which now makes it possible to do vertical gradients in Pine. I use it for both channels displayed by this script.
• I use the new arguments for plot() 's `display` parameter to control where the script plots some of its values,
namely those I only want to appear in the script's status line and in the Data Window.
• I wrote my script using the revised recommendations in the Style Guide from the Pine v5 User Manual.
█ THANKS
To PineCoders . I have used their lower_tf library in this script, to manage the calculation of the LTF and intrabar stats, and their Time library to convert a timeframe in seconds to a printable form for its display in the Information box.
To TradingView's Pine Script™ team. Their innovations and improvements, big and small, constantly expand the boundaries of the language. What this script does would not have been possible just a few months back.
And finally, thanks to all the users of my scripts who take the time to comment on my publications and suggest improvements. I do not reply to all but I do read your comments and do my best to implement your suggestions with the limited time that I have.

Bollinger Bands With User Selectable MABollinger Bands with user selection options to calculate the moving average basis and bands from a variety of different moving averages.
The user selects their choice of moving average, and the bands automatically adjust. The user may select a MA that reacts faster to volatility or slower/smoother.
Added additional options to color the bands or basis based on the current trend and alternate candle colors for band touches. Options:
REACT SLOW/SMOOTH TO VOLATILITY
simple moving average (Regular Bollinger Bands)
REACT SMOOTH TO VOLATILITY
exponential moving average (EMA Bollinger Bands)
weighted moving average (Weighted MA Bollinger Bands)
exponential hull moving average (Hull Bollinger Bands with better smoothing)
HIGHLY ADJUSTABLE TO VOLATILITY
Arnaud Legoux Moving average (ALMA Bollinger Bands)
Note: 0.85 ALMA default for more smoothing, set offset=1 to turn off smoothing
REACT HARSH TO VOLATILITY
least squares moving average (Least Squares Bollinger Bands)
REACT VERY FAST TO VOLATILITY
hull moving average (Hull Bollinger Bands or Hullinger Bands)
VALUE ADDED: This script is unique in that no other Bollinger Bands indicator offers a user selection for moving average, and some of the options do not exist yet as Bollinger Bands indicators.
Definitions:
Bollinger Bands: A Bollinger Band® is a technical analysis tool defined by a set of trendlines plotted two standard deviations (positively and negatively) away from a simple moving average (SMA) of a security's price, but which can be adjusted to user preferences.
Exponential Bollinger Bands: The most important characteristics of the Exponential Bollinger Bands indicator are: When the market is flat, the bands will stay much closer to prices. When the volatility is high, the bands move away from prices faster.
Hull Bollinger Bands: Bollinger Bands calculated by Hull moving average, rather than simple moving average or ema. The Hull Moving Average (HMA), developed by Alan Hull, is an extremely fast and smooth moving average. In fact, the HMA almost eliminates lag altogether and manages to improve smoothing at the same time.
Exponential Hull Bollinger Bands: Bollinger Bands calculated by Exponential Hull moving average, rather than simple moving average or ema. The Exponential Hull Moving Average is similar to the standard Hull MA, but with superior smoothing. The standard Hull Moving Average is derived from the weighted moving average (WMA). As other moving average built from weighted moving averages it has a tendency to exaggerate price movement.
Weighted Moving Average Bollinger Bands: A Weighted Moving Average (WMA) is similar to the simple moving average (SMA), except the WMA adds significance to more recent data points.
Arnaud Legoux Moving Average Bollinger Bands: ALMA removes small price fluctuations and enhances the trend by applying a moving average twice, once from left to right, and once from right to left. At the end of this process the phase shift (price lag) commonly associated with moving averages is significantly reduced. Zero-phase digital filtering reduces noise in the signal. Conventional filtering reduces noise in the signal, but adds a delay.
Least Squares Bollinger Bands: The indicator is based on sum of least squares method to find a straight line that best fits data for the selected period. The end point of the line is plotted and the process is repeated on each succeeding period.

+ BB %B: MA selection, bar coloring, multi-timeframe, and alerts+ %B is, at its simplest, the classic Bollinger Bands %B indicator with a few added bells and whistles.
However, the right combination of bells and whistles will often improve and make a more adaptable indicator.
Classically, Bollinger Bands %B is an indicator that measures volatility, and the momentum and strength of a trend, and/or price movements.
It shows "overbought" and "oversold" spots on a chart, and is also useful for identifying divergences between price and trend (similar to RSI).
With + %B I've added the options to select one or two moving averages, candle coloring, and a host of others.
Let's start with the moving averages:
There are options for two: one faster and one slower. Or combine them how you will, or omit one or both of them entirely.
Here you will find options for SMA, EMA (as well as double and triple), Hull MA, Jurik MA, Least Squares MA, Triangular MA, Volatility Adjusted MA, and Weighted MA.
A moving average essentially helps to define trend by smoothing the noise of movements of the underlying asset, or, in this case, the output of the indicator.
All of these MAs available track this in a different way, and it's up to the trader to figure out which makes most sense to him/her.
MA's, in my opinion, improve the basic %B by providing a clearer picture of what the indicator is actually "seeing", and may be useful for providing entries and exits.
Next up is candle coloring:
I've added the option for this indicator to color candles on the chart based on where the %B is in relation to its upper and lower bounds, and median line.
If the %B is above the median but below the upper bound, candles will be green (showing bullish market structure). If %B is below the median but above the lower bound, candles will be red (denoting bearish market structure).
Overbought and oversold candles will also be colored on the chart, so that a quick glance will tell you whether price action is bullish/bearish or "oversold"/"overbought".
I've also added functionality that enables candles to be colored based on if the %B has crossed up or crossed down the primary moving average.
One example as a way to potentially use these features is if the candles are showing oversold coloration followed by the %B crossing up your moving average coloration. You might consider a long there (or exit a short position if you are short).
And the last couple of tweaks:
You may set the timeframe to whatever you wish, so maybe you're trading on the hourly, but you want to know where the %B is on the 4h chart. You can do that.
The background fill for the indicator is split into bullish and bearish halves. Obviously you may turn the background off, or make it all one color as well.
I've also added alerts, so you may set alerts for "overbought" and "oversold" conditions.
You may also set alerts for %B crossing over or under the primary moving average, or for crossing the median line.
All of these things may be turned on and off. You can pretty much customize this to your heart's delight. I see no reason why anyone would use the standard %B after playing with this.
I am no coder. I had this idea in my head, though, and I made it happen through referencing another indicator I was familiar with, and watching tutorials on YouTube.
Credits:
Firstly, thanks to www.tradingview.com for his brilliant, free tutorials on YouTube.
Secondly, thanks to www.tradingview.com for his beautiful SSL Hybrid indicator (and his clean code) from which I obtained the MAs.
Please enjoy this indicator, and I hope that it serves you well. :)

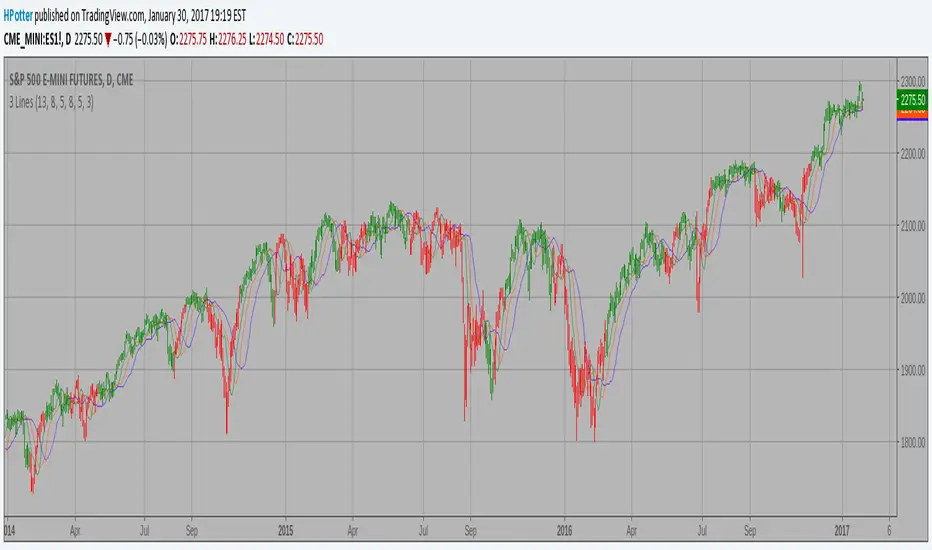
Bill Williams Averages. 3Lines Backtest This indicator calculates 3 Moving Averages for default values of
13, 8 and 5 days, with displacement 8, 5 and 3 days: Median Price (High+Low/2).
The most popular method of interpreting a moving average is to compare
the relationship between a moving average of the security's price with
the security's price itself (or between several moving averages).

Bill Williams Averages. 3Lines Strategy This indicator calculates 3 Moving Averages for default values of
13, 8 and 5 days, with displacement 8, 5 and 3 days: Median Price (High+Low/2).
The most popular method of interpreting a moving average is to compare
the relationship between a moving average of the security's price with
the security's price itself (or between several moving averages).
BTC Evaluation IndicatorBTC Evaluation Indicator
The BTC Evaluation Indicator is a volatility-based tool designed to help traders evaluate Bitcoin’s price behavior relative to its moving average trend. It combines customizable moving averages with dynamic standard deviation bands to identify overbought and oversold conditions.
Key Features
Flexible Moving Averages: Choose between SMA, EMA, WMA, VWMA, HMA, or RMA for the baseline trend.
Dynamic Volatility Bands: Upper and lower bands are calculated using standard deviation, scaled by a user-defined multiplier.
Visual Clarity:
Orange line = central moving average (trend mean)
Green line = upper band (potential overbought zone)
Red line = lower band (potential oversold zone)
Shaded gray area = volatility range
Automatic Highlights: Background shading marks when price breaks above the upper band (overbought) or below the lower band (oversold).
How to Use
When price pushes above the upper band, it may indicate overextension or potential local overbought conditions.
When price falls below the lower band, it may signal undervaluation or potential oversold conditions.
The mean line acts as a dynamic equilibrium, often serving as short-term support/resistance.
This indicator is designed for Bitcoin evaluation, but it can be applied to any asset. By combining trend analysis with volatility context, it helps traders better understand when price may be stretched and when conditions are reverting to the mean.

Multi Moving Average with CustomizationCore Functionality
The indicator allows you to display up to 5 different moving averages on your chart simultaneously.
Each moving average can be fully customized with its own settings.
You can choose between
1. Simple Moving Average (SMA),
2. Exponential Moving Average (EMA)
3. Weighted Moving Average (WMA) types
Multi-Timeframe Support
One standout feature is the ability to display higher timeframe moving averages on lower timeframe charts.
For example, you can show a 200 EMA from the daily chart while viewing a 15-minute chart.
Advanced Visualization Features
The indicator includes several visualization enhancements:
1. MA Cloud - Creates a filled area between any two selected moving averages. The cloud automatically changes color based on which MA is on top - typically green when the faster MA is above (bullish) and red when below (bearish).
2. Golden/Death Cross Detection - Automatically detects and marks important MA crossover events:
* Golden Cross: When a shorter-term MA crosses above a longer-term MA (bullish signal)
* Death Cross: When a shorter-term MA crosses below a longer-term MA (bearish signal)
3. Trend Background - Colors the entire chart background based on whether price is above or below a specified MA, giving a clear visual indicator of the overall trend.
Alert System
The indicator can generate alerts when price crosses above or below any selected moving average. This feature is useful for automated trading signals or notifications, and can be configured to trigger once per bar.
Flexible Architecture
The code uses several programming techniques to maximize flexibility:
* Switch statements for selecting MA types and cloud values
* Conditional logic throughout the code
* Function abstraction for calculating MAs and handling multi-timeframe display
* String identifiers to select which MAs to use for cloud visualization
Unique Technical Aspects
1. The multi-timeframe plotting function solves the common problem of higher timeframe MAs looking distorted on lower timeframe charts.
2. The cloud feature uses string identifiers to select which MAs to use, allowing for any combination.
3. The indicator employs smart conditional logic to handle complex decision trees efficiently.
4. Every visual aspect (colors, line widths, display conditions) is customizable through the settings.
This indicator combines multiple technical analysis tools into a single, highly configurable package that can adapt to different trading styles and timeframes.
Its ability to correctly display higher timeframe MAs on lower timeframe charts makes it particularly valuable for traders who analyze multiple timeframes simultaneously.
Crypto_in_details_MAlibCrypto_in_details_MaLib — Advanced Moving Average Library for Pine Script
Overview:
Crypto_in_details_MaLib is a comprehensive, performance-optimized Moving Average (MA) library designed specifically for Pine Script v6 users seeking advanced technical analysis tools. Developed by Crypto_in_details, this library consolidates the most popular and sophisticated MA calculation methods — including classical, weighted, exponential, and Hull variants — into one seamless package.
Key Features:
Implements a wide range of Moving Averages: SMA, EMA, WMA, RMA, VWMA, HMA, TEMA, EHMA, THMA.
Designed for precision and flexibility — suitable for diverse trading strategies and indicator development.
Fully typed functions compatible with Pine Script v6 standards.
Simplifies your scripting workflow by providing ready-to-use MA functions via clean and easy-to-import methods.
Well-documented and maintained by an experienced Pine Script developer.
Why Use Crypto_in_details_MaLib?
Gain access to advanced MA calculations that enhance trend analysis, smoothing, and signal accuracy.
Save time on coding complex moving averages from scratch.
Easily extend or combine with your own strategies or indicators for improved performance.
Rely on a tested and community-driven solution backed by a prolific Pine Script author.
Ideal for:
Traders and developers building custom indicators or strategies requiring versatile MA techniques.
Anyone looking to improve their Pine Script efficiency and code maintainability.
Pine Script enthusiasts wanting a professional-grade MA toolkit.

Multi-Symbol Trend DashboardMulti-Symbol Trend Dashboard - MA Cross Trend Monitor
Short Description
A customizable dashboard that displays trend direction across multiple symbols and timeframes using moving average crossovers.
Full Description
Overview
This Multi-Symbol Trend Dashboard allows you to monitor trend direction across 7 different symbols and 5 timeframes simultaneously in a single view. The dashboard uses moving average crossovers to determine trend direction, displaying bullish trends in green and bearish trends in red.
Key Features
Multi-Symbol Monitoring : Track up to 7 different trading instruments at once
Multi-Timeframe Analysis: View 5 different timeframes simultaneously for each instrument
Customizable Moving Averages: Choose between SMA, EMA, or WMA with adjustable periods
Visual Clarity: Color-coded cells provide immediate trend identification
Flexible Positioning: Place the dashboard anywhere on your chart
Customizable Appearance: Adjust sizes, colors, and text formatting
How It Works
The dashboard calculates a fast MA and slow MA for each symbol-timeframe combination. When the fast MA is above the slow MA, the cell shows green (bullish). When the fast MA is below the slow MA, the cell shows red (bearish).
Use Cases
Get a bird's-eye view of market trends across multiple instruments
Identify potential trading opportunities where multiple timeframes align
Monitor your watchlist without switching between charts
Spot divergences between related instruments
Track market breadth across sectors or related instruments
Notes and Limitations
Limited to 7 symbols and 5 timeframes due to TradingView's security request limits
Uses simple MA crossover as trend determination method
Dashboard is most effective when displayed on a dedicated chart
Performance may vary on lower-end devices due to multiple security requests
Settings Explanation
MA Settings: Configure the periods and types of moving averages
Display Settings: Adjust dashboard positioning and visual elements
Trading Instruments: Select which symbols to monitor (defaults to major forex pairs)
Timeframes: Choose which timeframes to display (default: M15, H1, H4, D1, W1)
Colors: Customize the color scheme for bullish/bearish indications and headers
This dashboard provides a straightforward way to maintain situational awareness across multiple markets and timeframes, helping traders identify potential setups and market conditions at a glance.

BONK 1H Long Volatility StrategyGrok 1hr bonk strategy:
Key Changes and Why They’re Made
1. Indicator Adjustments
Moving Averages:
Fast MA: Changed to 5 periods (from, e.g., 9 on a higher timeframe).
Slow MA: Changed to 13 periods (from, e.g., 21).
Why: Shorter periods make the moving averages more sensitive to quick price changes on the 1-hour chart, helping identify trends faster.
ATR (Average True Range):
Length: Set to 10 periods (down from, e.g., 14).
Multiplier: Reduced to 1.5 (from, e.g., 2.0).
Why: A shorter ATR length tracks recent volatility better, and a lower multiplier lets the strategy catch smaller price swings, which are more common hourly.
RSI:
Kept at 14 periods with an overbought level of 70.
Why: RSI stays the same to filter out overbought conditions, maintaining consistency with the original strategy.
2. Entry Conditions
Trend: Requires the fast MA to be above the slow MA, ensuring a bullish direction.
Volatility: The candle’s range (high - low) must exceed 1.5 times the ATR, confirming a significant move.
Momentum: RSI must be below 70, avoiding entries at potential peaks.
Price: The close must be above the fast MA, signaling a pullback or trend continuation.
Why: These conditions are tightened to capture frequent volatility spikes while filtering out noise, which is more prevalent on a 1-hour chart.
3. Exit Strategy
Profit Target: Default is 5% (adjustable from 3-7%).
Stop-Loss: Default is 3% (adjustable from 1-5%).
Why: These levels remain conservative to lock in gains quickly and limit losses, suitable for the faster pace of a 1-hour timeframe.
4. Risk Management
The strategy may trigger more trades on a 1-hour chart. To avoid overtrading:
The ATR filter ensures only volatile moves are traded.
Trading fees (e.g., 0.5% on Coinbase) reduce the net profit to ~4% on winners and -3.5% on losers, requiring a win rate above 47% for profitability.
Suggestion: Risk only 1-2% of your capital per trade to manage exposure.
5. Visuals and Alerts
Plots: Blue fast MA, red slow MA, and green triangles for buy signals.
Alerts: Trigger when an entry condition is met, so you don’t need to watch the chart constantly.
How to Use the Strategy
Setup:
Load TradingView, select BONK/USD on the 1-hour chart (Coinbase pair).
Paste the script into the Pine Editor and add it to your chart.
Customize:
Adjust the profit target (e.g., 5%) and stop-loss (e.g., 3%) to your preference.
Tweak ATR or MA lengths if BONK’s volatility shifts.
Trade:
Look for green triangle signals and confirm with market context (e.g., volume or news).
Enter trades manually or via TradingView’s broker tools if supported.
Exit when the profit target or stop-loss is hit.
Test:
Use TradingView’s Strategy Tester to backtest on historical data and refine settings.
Benefits of the 1-Hour Timeframe
Faster Opportunities: Captures shorter-term uptrends in BONK’s volatile price action.
Responsive: Adjusted indicators react quickly to hourly changes.
Conservative: Maintains the 3-7% profit goal with tight risk control.
Potential Challenges
Noise: The 1-hour chart has more false signals. The ATR and MA filters help, but caution is needed.
Fees: Frequent trading increases costs, so ensure each trade’s potential justifies the expense.
Volatility: BONK can move unpredictably—monitor broader market trends or Solana ecosystem news.
Final Thoughts
Switching to a 1-hour timeframe makes the strategy more active, targeting shorter volatility spikes while keeping profits conservative at 3-7%. The adjusted indicators and conditions balance responsiveness with reliability. Backtest it on TradingView to confirm it suits BONK’s behavior, and always use proper risk management, as meme coins are highly speculative.
Disclaimer: This is for educational purposes, not financial advice. Cryptocurrency trading, especially with assets like BONK, is risky. Test thoroughly and trade responsibly.

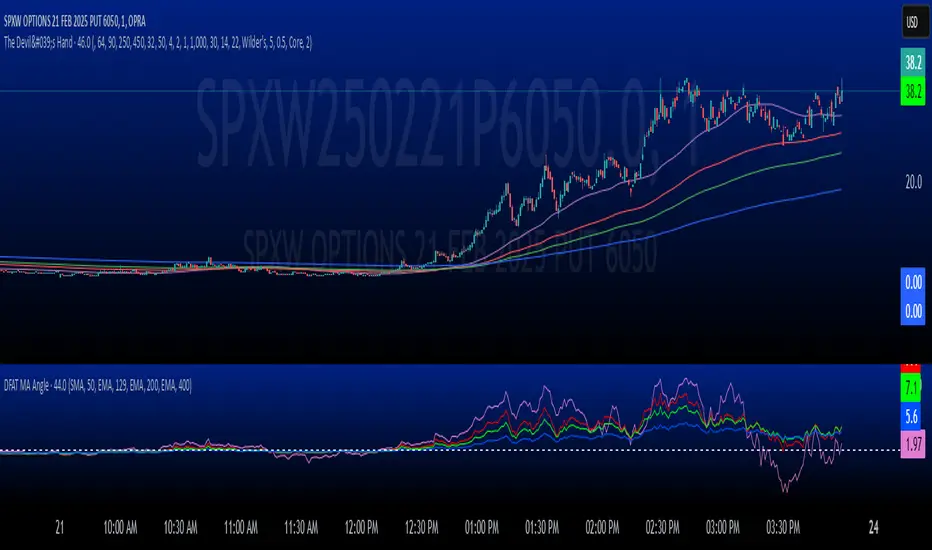
Ronnie's DikFat Attack - Moving Average Angle/Slope PositionRonnie's DikFat Attack - True Moving Average Angle/Slope Position
Overview
This TradingView indicator, written in Pine Script version 5, injects energy into your chart analysis by calculating and displaying the angles of four moving averages (MAs). It empowers you to customize each MA—choosing both type and length—to suit your trading strategy perfectly.
How It Works
1. User Inputs:
Under the “MA Settings” group, the script offers an intuitive interface where you can define four different moving averages. Each MA can be set to one of several types (SMA, EMA, SMMA, VWMA, Hull, WMA, or TEMA) and assigned a specific length (number of bars).
2. Dynamic Moving Average Calculation:
A dedicated function ( getMA ) selects and computes the appropriate moving average using TradingView’s built-in functions (like ta.ema , ta.sma , etc.). This yields four customized MA series based on your inputs.
3. Calculating the Angle of Momentum:
The script employs a robust function ( calcAngle ) that measures the change between consecutive values of each MA to determine its slope. This slope is then converted into an angle in degrees using the arctangent function, providing a clear and vivid depiction of trend strength and direction.
4. Visualizing the Angles:
Each moving average’s angle is plotted with its own distinct color, enhancing visual clarity. A horizontal line at 0° acts as a reference point, marking the divide between upward and downward momentum.
Potential Uses
Trend Analysis:
The angle measurement offers a dynamic perspective on trend strength. Steep positive angles suggest vigorous upward movement, while steep negative angles indicate strong downward trends.
Signal Confirmation:
By comparing the angles of multiple moving averages, you can quickly spot momentum shifts and crossover points, which may serve as powerful entry or exit signals.
Tailored Strategy Customization:
The flexibility to choose various MA types and lengths allows this tool to adapt seamlessly to different timeframes and trading styles, enhancing its usefulness in diverse market conditions.